Visualizing Concepts and Mappings
With BioPortal, you can visualize ontology concepts and their mappings with other ontologies. The following information is available on this page:
How BioPortal displays concepts and mappings
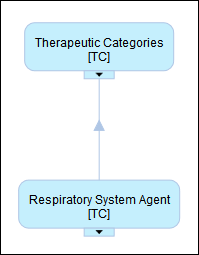
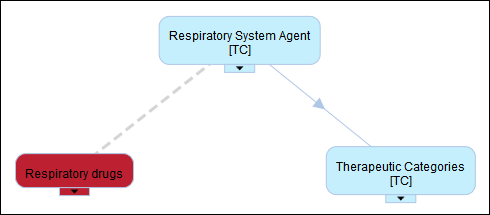
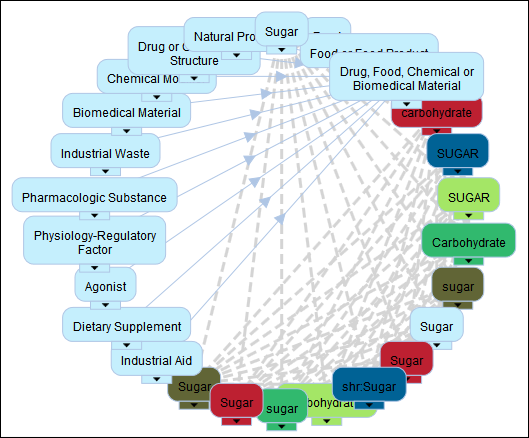
BioPortal displays individual ontology concepts and mappings as nodes. Lines are used to indicate the relationships among concepts and mappings. Directional relationships (parent/child relationships) are identified by a solid line with an arrow pointing to the parent concept. Mappings are identified by a dotted line.
Viewing concepts and mappings
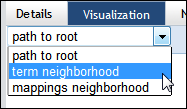
To get started, open the Term Details page for a concept, and click the Visualization tab.
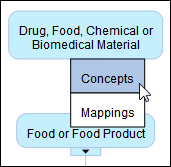
Once you have visualized a concept, you can expand the visualization to include the child concepts or mappings from any item. To do this, click the arrow below the desired concept or mapping, and then select:
|
You can expand the concepts and mappings outside of the current ontology. This makes it possible to visualize multiple ontologies at once and see the relationships between them. To make it easier to see relationships, BioPortal uses colors to identify ontologies. However, depending on how many ontologies you are working with, some colors may be duplicated. For information, see the section on Nodes.
Viewing information about a concept or mapping
You can hover over a concept or mapping to display the name and ID of the ontology the item resides in.
Removing a mapping or concept from a visualization
If a mapping or concept is no longer of interest to you, you can remove the related ontology from the visualization. You cannot remove a concept or mapping without removing its entire ontology. For information, see the section on Nodes.
Changing how concepts and mappings are displayed
When visualizing ontology information, you can adjust how the concepts and mappings are displayed. To do this, click the chevron in the top-right corner of the Visualization panel.
This displays a panel with three groups of options: Nodes, Arcs, and Layouts.
Nodes
The Nodes portion of the side panel displays a list of the ontologies that are currently visualized, either through mappings or expanded concepts. It also displays the color associated with an ontology.
You can choose to remove a particular ontology from the visualization. To do this, clear the check box next to the ontology name.
You can also choose to not use colors to identify ontologies. To do this, clear the Color Concept Nodes by Ontology check box.
Arcs
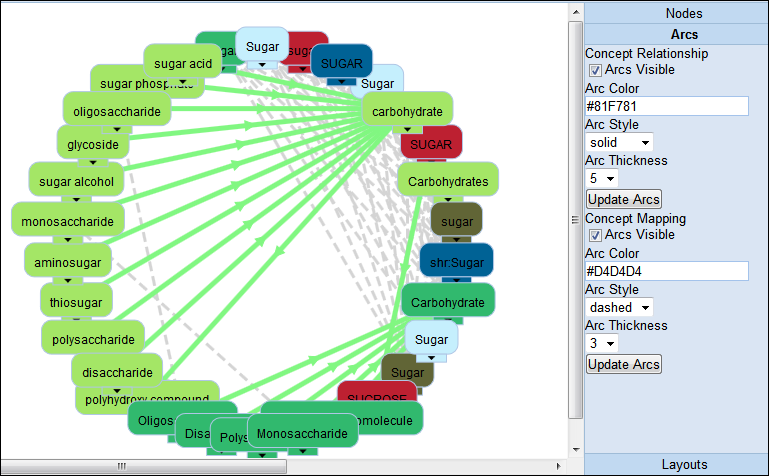
By default, concepts are connected by a solid line with arrows that point towards the parent concept. Mappings are connected by a dashed line. If desired, you can change the color and style of these connections using the Arcs portion of the side panel.
The Arcs options are divided into separate controls for the concept relationships and the concept mappings. You can change the following options:
- Arcs Visible: This check box controls whether lines are displayed.
- Arc Color: This box defines the color of the lines that connect concepts or mappings. You can use any seven-character HTML color code.
- Arc Style: This drop-down list defines the style of the line displayed (solid or dashed).
- Arc Thickness: This drop-down list defines the thickness of the line displayed, in pixels.
Once you are finished, click the Update Arcs button and the changes will be applied to your visualization. Please note that there are two Update Arcs buttons – one for the options that control concept relationships, and one for the options that control concept mappings.
Layouts
You can adjust the style of visualization used to optimize the display and to make it easier to view related information. The Layouts portion of the side panel displays four different layouts:
- Circle Layout: This layout displays the concepts and mappings in a circle.
- Vertical Layout: This layout displays the concepts and mappings with child/parent relationships organized vertically.
- Horizontal Layout: This layout displays the concepts and mappings with child/parent relationships organized horizontally.
- Force-Directed Layout: This layout positions the concepts and mappings so that all the edges are of more or less equal length and with as few crossing edges as possible. Use the Force-Directed Layout when working with clusters of data to optimize the display of related groups of information.
